How long can Russia sustain the war in Ukraine?
Dr. Vlad Bernstein and ChatGPT 4o
The Russian invasion of Ukraine has underscored the global conflict between authoritarian and democratic nations, with Russia asserting a dominant role. With its substantial military power, nuclear capabilities, and the reckless aggressiveness of its leadership, Russia now poses a significant threat to global security.
The only plausible solution to this problem is to reduce Russia’s economic and military capabilities to the point where it can no longer continue the war or project its aggression elsewhere. According to ChatGPT’s analysis, achieving this would likely require a 20–30% contraction of the Russian economy to prompt meaningful internal change.
Fortunately, initial assumptions about Ukraine’s vulnerability, Russia’s military superiority, and the West’s lack of resolve have proven false. The supposedly swift Russian “special military operation” has devolved into a protracted war of attrition, creating an opportunity to gradually weaken the Russian economy.
With Ukraine dependent on Western financial and military support, the war’s trajectory hinges on two critical factors: the West’s ability to sustain its aid and Russia’s capacity to endure the escalating costs of war.
According to Kiel Institute, despite fluctuations in the aid packages, the average level of support for the past three years has remained steady at approximately 148 billion USD per year. This amount represents less than 0.3% of the combined GDP of donor countries, a level sustainable for long-term support.
International aid, encompassing financial, humanitarian, and military components, has enabled Ukraine’s total annual military expenditure (including both international aid and internal Ukrainian military spending) to reach approximately 165 billion USD.
In contrast to Ukraine, Russia must rely solely on its economy to support military expenditures, which in 2025 are projected to reach (including indirect spending) around 180 billion USD, equivalent to about 9% of GDP. Although this figure is slightly higher than Ukraine’s, comparing losses suggests that Ukraine achieves roughly 2-3 times greater efficiency in its spending. This efficiency enables military parity and has the potential of gradually depleting Russia’s resource base to the level of inevitable internal structural changes.
Unlike peacetime, when forecasting economic behavior is complicated by numerous competing factors, wartime simplifies the analysis as military spending becomes the dominant force. A methodology that examines how resource imbalances affect accumulated reserves can provide reliable results while bypassing the broader complexities of the economy.
The chart below offers a 10-year projection of Russia’s wealth trajectory from the onset of the full-scale invasion of Ukraine, utilizing the mentioned methodology. It outlines two scenarios—Aggressive and Conservative—based on distinct sets of input variables, estimating the likely timeframe for a potential regime change in Russia.
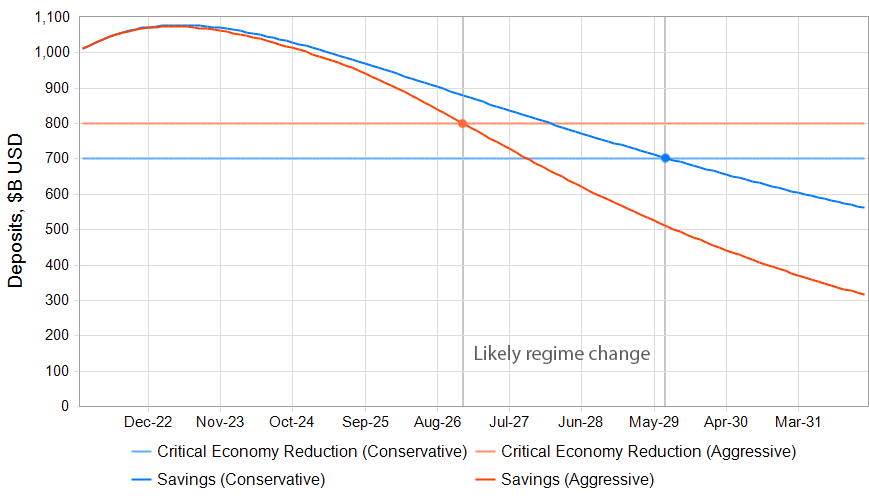
The interactive version of this chart, complete with explanations, can be found here. It allows adjustment of input variables to observe their impact on the projected outcomes.
Resource Flows and Imbalance Calculation
Any economy can be represented as a system that produces and consumes resources. The fundamental behavior of such a system is governed by the law of conservation of energy, matter, and resources, which can be expressed by the following equation:
Savings(t) = Initial Savings + RFI(t)
Where:
- RFI = Income(t) — Expense(t) — Resource Flow Imbalance
- Savings represent accumulated resources (wealth).
- Income is the total flow of resources generated within the system or received externally.
- Expense is the combined flow of resources consumed or lost.
Resource Flow Imbalance (RFI) plays a key role in understanding the dynamics of the wartime economy. In large, healthy economies, the imbalance between Income and Expense typically remains slightly positive, supporting steady annual savings growth of 3–4%. Accumulated resources are generally proportional to annual income (GDP), serving as a key indicator of national wealth.
For Russia, RFI includes the following most relevant components:
RFI = Iprd + Iexp — Econ — Emil — Esnc
After the variables substitute,
Savings(t) = Initial Savings + Iprd(t) + Iexp(t) — Econ(t) — Emil(t) — Esnc(t)
Where:
— Iprd — Imbalance of Non-Military Production
— Iexp — Imbalance of Profit from Natural Resources Export
— Econ — Imbalance in Public Consumption
— Emil — Imbalance of Military Spending
— Esnc — Effect of Western sanctions
During wartime, if the war-related expenditure exceeds the prewar growth rate, then RFI moves into a negative zone, driving the process of depleting accumulated wealth.
Russia’s Reserves and Savings
The average growth rate of the Russian economy for the 7 prewar years was about 1%, and the accumulated wealth was approximately $1.63 trillion (about $1 trillion in corporate and personal accounts and around $0.63 trillion in government reserves). After the West seized about $300 billion of Russian foreign assets, the combined figure was reduced to $1.33 trillion.
During the first three years of the war, three significant one-time events impacted the reserves and the resource flows:
- Military Investment: About $300 billion has been directed from the government reserves into the military industry.
- Oil Price Surge (2022): Provided an additional $200 billion in profit.
- Capital Flight: Around $250 billion have been moved out of the country.
So, the total amount of accumulated resources has been increased by the $200 billion of the oil price surge money and reduced by the $370B ($82B + $120B + $168B) of military spending and the $250 billion of capital flight, bringing the total number to $.
Non-Military Production
During wartime, non-military production typically remains stable, with some resources redirected toward military production, which the intensification of the labor force could partially compensate for. Thus, it would be reasonable to assume that the imbalance of Non-Military Production is close to zero.
Imbalance of Non-Military Production: Iprd = 0
Export of Natural Resources
Natural resource exports, particularly oil and gas, are critical to Russia’s economy, contributing about 15-20% of GDP and 40-50% of government revenue. Crude oil, petroleum products, and natural gas account for 50-60% of Russia’s total export revenue, making export profits highly dependent on global oil prices.
The chart below (generated by ChatGPT-4) illustrates the relationship between oil market prices and export revenue.

With pre-war Brent oil prices around $75 per barrel and a production cost of approximately $20 per barrel, Russia’s oil export profits totaled about $100 billion annually. Apart from the 2022 oil price surge (already accounted for as an extra reserve increase), prices remained stable through the end of 2024. Therefore, it would be reasonable to assume that under the conservative scenario, the export resource flow will remain unchanged, resulting in a zero imbalance component.
However, multiple sources indicate that Saudi Arabia has ambitious plans to increase its oil exports from 7 million barrels per day (bpd) to 9.3 million bpd by 2025 and to 10.4 million bpd by the end of 2026. The chart below illustrates the oil prices required to maintain current profit levels as a function of export volumes for both Saudi Arabia and Russia.

The chart above suggests that oil prices are likely to decline to around $60 per barrel in the first quarter of 2025 and fall below $55 per barrel by the end of 2026. Combined with the rising cost of Russian oil production—from $20 to approximately $50 per barrel—this would create a significant export profit imbalance. Assuming the market price drops to $55 per barrel, the imbalance for the aggressive scenario comes to d(Iexp) = −128 per barrel.
Conservative scenario: d(Iexp) = 0
Aggressive scenario: d(Iexp) = −128 per barrel
Public Consumption
Public consumption is closely tied to the level of accumulated savings, and naturally declines as these resources are depleted. In Russia, savings typically amount to approximately 50% of GDP, expressed as Savings = 0.5 × Econ. This relationship is integral to calculating the resource flow imbalance in public consumption.
Military Expenses
Russia’s military expenses encompass both its official military budget and an additional 15–20% in indirect spending. Before the war, the official military budget stood at approximately $65 billion, with total military expenditures, including indirect costs, amounting to $75–78 billion annually in 2021.
Since the onset of the war, the official military budget has increased significantly, reaching $145 billion by 2025. When combined with indirect spending, the total annual military expenditure has risen to $167–174 billion. This surge has led to an estimated resource flow imbalance ranging from −$92 billion (conservative scenario) to −$96 billion (aggressive scenario) per year.
- Conservative Scenario (15% indirect spending): d(Imil) = −$92 billion per year
- Aggressive Scenario (20% indirect spending): d(Imil) = −$96 billion per year
Effect of Western sanctions
The Western sanctions imposed on Russia in response to the conflict in Ukraine targeted critical sectors, including energy, technology, and finance, creating significant financial pressures. Early projections by institutions such as the IMF and World Bank estimated annual GDP losses of 5–8% due to sanctions. However, actual data from 2021 to 2024 reveals a more moderate impact, with GDP contractions averaging 2–3% annually.
Given an average nominal GDP of approximately $2,000 billion during this period, the reduction translates to an annual income loss of $40 billion (conservative scenario) to $60 billion (aggressive scenario).
- Conservative Scenario (2% GDP per year): d(Esnc) = −$40 billion annually.
- Aggressive Scenario (3% GDP per year): d(Esnc) = −$60 billion annually.
Means of financing the war
As shown above, the war-related extra (over the prewar time) expenses (WarExp) consist of three main components:
WarExp = M + S + E
Where,
M — additional military spending (92-96 billion USD per year)
S — effect from imposed Western sanctions (40-60 billion USD per year)
E — projected reduction of natural resource export profit (0-130 billion USD per year)
The combined war-related annual burden on the Russian economy is currently estimated at $132-156 billion per year, but it is likely to reach $286 billion per year due to the reduced export profit imposed by the anticipated oil price reduction.
These estimates allow for the consideration of three probable scenarios:
WarExp1 = 92 + 40 = $132 billion per year — conservative
WarExp2 = 96 + 60 = $156 billion per year — medium
WarExp3 = 96 + 60 + 130 = $286 billion per year — aggressive
Over the three years of war, nearly all strategic government reserves were depleted, leaving the state with one primary option for financing its military expenditures by extracting funds from the wealth accumulated in corporate and private deposits.
Mechanisms of Financing
Russia employs three primary mechanisms to address these growing expenditures:
- Government Bond Sales
- Increased Taxation
- Imbalanced Inflation
These mechanisms can be expressed in the following equation:
M + S + E = B + T + F
Where
B — government bond sale
T — funds obtained via additional taxation
F — funds extracted from the population via imbalanced inflation
Government Bonds Sale
In 2024, approximately $60–90 billion was raised through bond sales, with significant participation from households and private institutions. While this approach avoids immediate taxation, it increases future financial obligations, as the government must repay these debts with interest.
Increased Taxation
The Russian government has implemented extensive tax reforms to boost revenues, targeting both individuals and corporations:
- Income Tax Reforms: These measures are estimated to generate an additional
$6 billion annually. - Corporate Tax Hikes: With corporate taxes increased from 20% to 25%, an additional $18 billion was collected in 2024.
In total, taxation contributes to financing the war approximately $24 billion per year.
Imbalanced Inflation
Inflation functions as a mechanism for extracting funds from the population when the household inflation rate exceeds wage growth. The extracted funds (F) can be calculated using the following equation:
F = (Hinf — Wgrw) * C / 100
Where
F — the extracted funds.
C — annual public spending.
Hinf — household inflation rate, reflecting the percentage increase in the cost of living.
Wgrw — wage growth rate, reflecting the percentage increase in household earnings.
By substituting the inflation component (F), the full equation describing the war-related resource imbalance compensation process becomes:
M + S + E = B + T + (Hinf — Wgrw) * C / 100
The expected household inflation rate (Hinf) can then be calculated as:
Hinf = Wgrw + 100 * (M + S + E — B — T)/C
The chart below shows the household inflation (Hinf) as a function of wage growth (Wgrw) for the three sets of input values: Conservative, Medium, and Aggressive.
Household Inflation as a function of wage growth rate
(billion USD per year):
C = 980; B = 70; T = 24
| Scenario | M | S | E |
|---|---|---|---|
| Conservative | 92 | 40 | 0 |
| Medium | 96 | 60 | 0 |
| Aggressive | 96 | 60 | 130 |

The Medium line aligns well with the current trends observed in Russia: the wage growth rate in 2024 was around 17-18%, and household inflation, as reported by ROMIR (and lately by official sources) stands at approximately 21-22% per year. The chart suggests that household inflation could increase by as much as 37% if oil prices decline to $55 per barrel (assuming the wage growth rate remains unchanged).
Conclusion
The Russian invasion of Ukraine has not only highlighted the stark divide between authoritarian and democratic nations but has also underscored the critical importance of international support in maintaining global security. The ongoing conflict has demonstrated that reducing Russia’s economic and military capabilities is essential to curbing its aggressive actions. This goal can be achieved through sustained international aid to Ukraine and strategic economic measures aimed at weakening Russia’s resource base.
Ukraine’s resilience, bolstered by consistent Western support, has shown that even in the face of significant military and economic challenges, a determined nation can effectively resist aggression. In stark contrast, Russia’s isolated economy, constrained by limited resources, is unlikely to sustain the war for more than a few years.
During the first three years of the conflict, after Russia exhausted its strategic reserves that had temporarily sustained its economy and even allowed for slight growth, it entered a phase of steady decline in 2025. This decline is occurring at a rate of 13–16% per year, with projections suggesting it will accelerate further as oil prices are expected to drop.
The primary mechanisms for financing the war—issuing government bonds and increasing taxes—are driving household inflation to unsustainable levels of 30–40% annually. As a result, an internal regime change by the end of 2028 appears increasingly likely, driven by resource depletion and growing domestic pressures.
Ultimately, the path to peace and stability lies in the continued commitment of the international community to support Ukraine and uphold the principles of sovereignty and democracy. By doing so, we can ensure that the sacrifices made in this conflict lead to a more secure and just world.
